Application Gateway
View Logs
- Navigate to your Log Analytics Workspace in the Azure portal
.
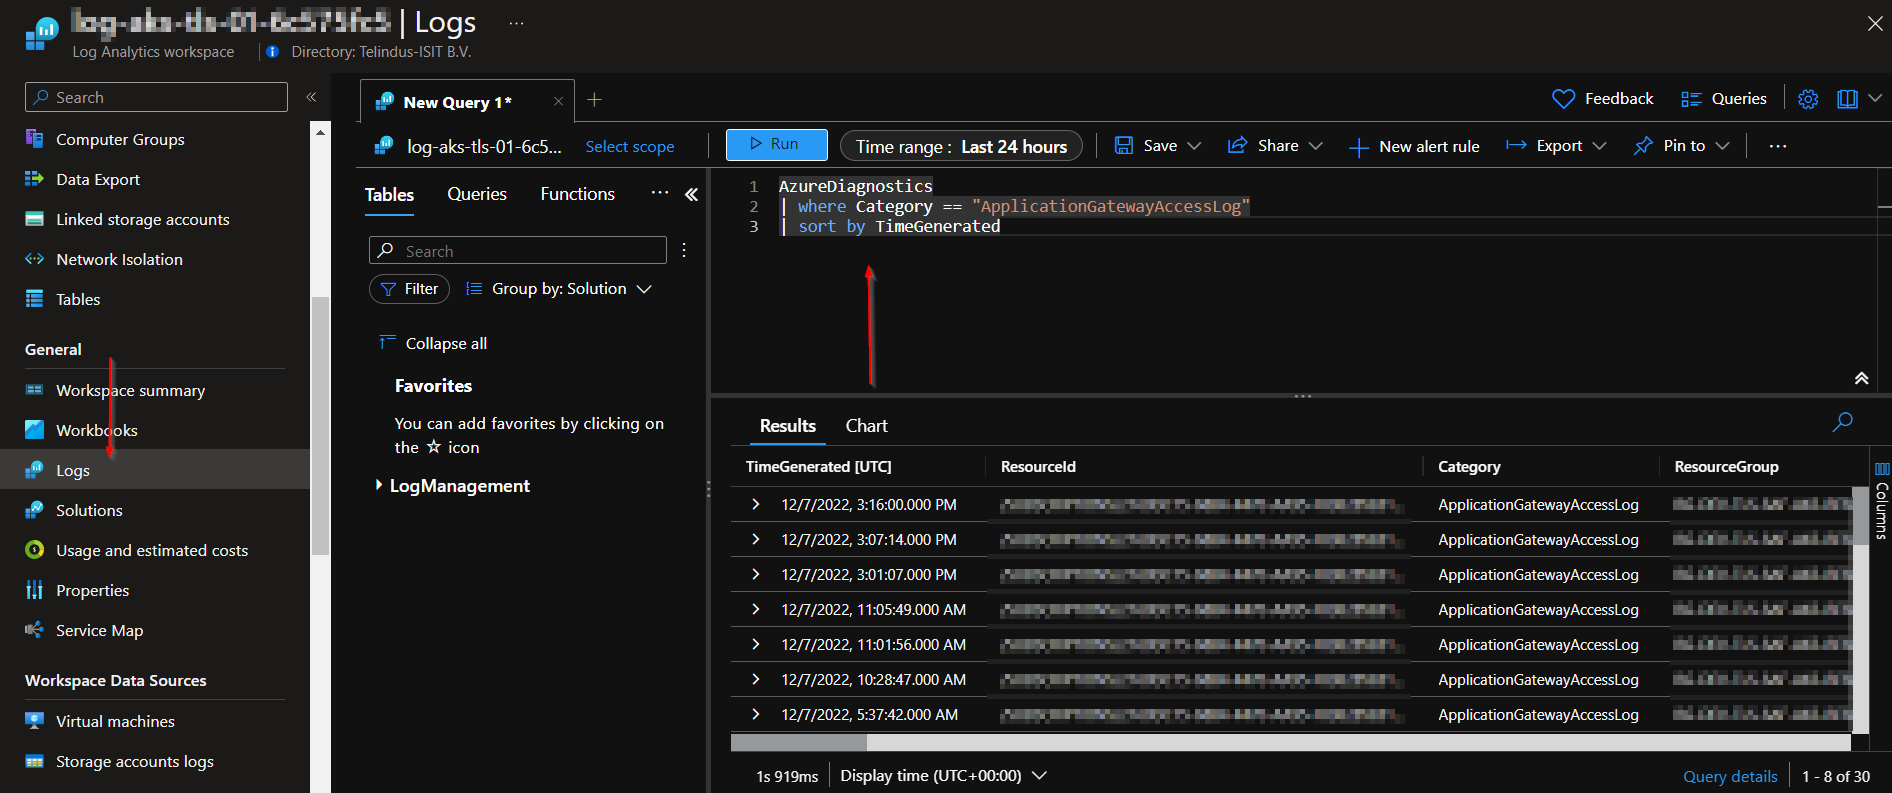
You can find workspace in the resource group:rg-<environment>-<short company name>-<workload name>-akse.g. ' rg-prod-tls-cmaas-aks' - In the navigation panel on the left, click on logs to open the query editor
- Run a query to get log data
Example queries:
# List all Application Gateway Access logs without any filter

AzureDiagnostics
| where Category == "ApplicationGatewayAccessLog"
| sort by TimeGenerated


# Create an access view for all hosts based on 30 minutes intervals.

AzureDiagnostics
| where Category == "ApplicationGatewayAccessLog"
//| where host_s == "your-hostname.com"
| summarize count() by host_s, bin(TimeGenerated, 30m)
| render timechart


# Create an access view for a dedicated API or URI of a host based on 30 minutes intervals.

AzureDiagnostics
| where Category == "ApplicationGatewayAccessLog"
| where requestUri_s == "/your-uri"
| summarize count() by requestUri_s, bin(TimeGenerated, 30m)
| render timechart


# Get HTTP status codes for a dedicated host.

AzureDiagnostics
| where Category == "ApplicationGatewayAccessLog"
| where host_s == "your-hostname.com"
| summarize count() by httpStatus_d


# Search for a dedicated status code on a dedicated host.

AzureDiagnostics
| where Category == "ApplicationGatewayAccessLog"
| where host_s == "your-hostname.com"
| where httpStatus_d == ""
| sort by TimeGenerated
Last modified July 3, 2023: + Improved nginx version in deployment example (a8ba98a)